A complete technical description of the computational pipeline — from raw Cell Ranger output to ranked dual-marker candidates. This reads like a methods section.
01
Data Ingestion & Quality Control
Raw Cell Ranger outputs (raw_feature_bc_matrix.h5) are parsed for each of the 54 patient samples. Quality control removes empty droplets and dying cells using three filters: minimum gene count, maximum mitochondrial read fraction, and minimum total UMI count.
Filtered cells are exported as .h5ad files (AnnData format) for downstream processing. Metadata (patient ID, tissue type, sample batch) are embedded in adata.obs.
Gene counts per cell — histogram (QC filter threshold shown)
Single-cell RNA sequencing exhibits stochastic dropout and technical noise. We train a variational autoencoder (scVI) to infer latent representations approximating true gene expression distributions. This enables stable binarisation for downstream combinatorial optimisation, replacing noisy raw counts with smooth denoised values.
where $z_i \in \R^d$ is the latent cell state, $s_i$ is library size, $\mu_{ij}$ is
the decoded mean expression (a neural network), and $\phi_j$ is a learned gene-specific
dispersion. The inference network $q(z_i | x_i)$ gives us the denoised latent $z_i$
which we decode back to get $\hat{\mu}_{ij}$ — our denoised expression estimate.
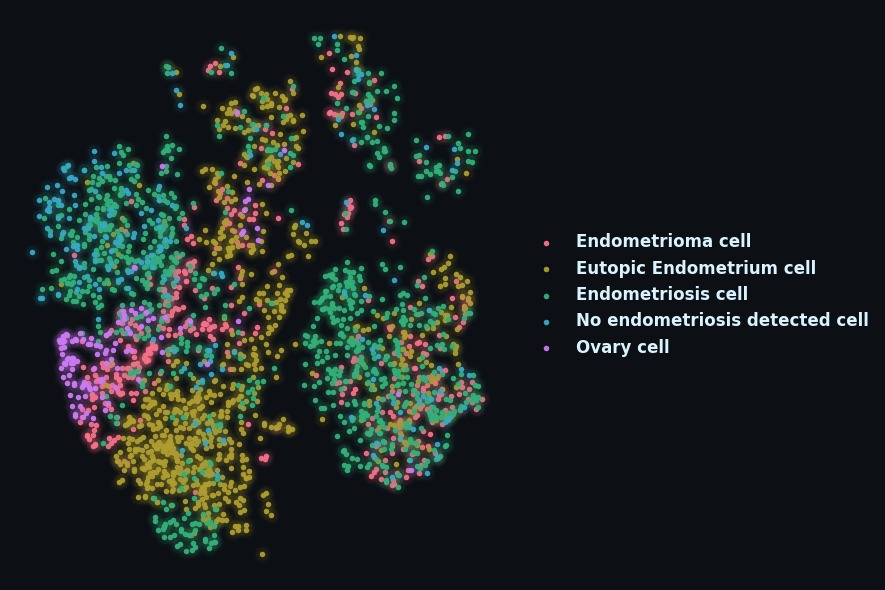
UMAP embedding — denoised latent space (mock, n=~280k cells)
The combinatorial search space contains ~4.5 million possible marker pairs. Instead of brute-force enumeration, we relax the discrete selection problem using a Gumbel-Softmax formulation. Gradient descent is performed in continuous space before annealing back to a discrete pair selection.
We believe this specific formulation — applied to transcriptomic target discovery with an AND-gate objective — is novel. Full derivation →
Training loss curve — gradient descent convergence
04
Safety Filtering via Whole-Body Atlas
Candidate markers are cross-referenced against Tabula Sapiens. Expression in heart, lung, brain or other critical tissues incurs an infinite penalty and is excluded. Only lesion-specific dual markers survive this filter.
HeartEXCLUDED
Brain / CNSEXCLUDED
LungEXCLUDED
LiverEXCLUDED
KidneyEXCLUDED
Ectopic lesionTARGET ✓
Eutopic endometriumCLEAR ✓
05
Output — Ranked Candidate Pairs
Gradient descent outputs a ranked top-5 list of dual marker combinations. Each pair is scored on specificity (expression in ectopic vs control) and safety (expression in whole-body atlas). The top pairs are handed off for benchtop feasibility assessment.